Some more on the BOM Annual Climate Report, or at least the reaction to it. Speaking on the World Today, Professor Will Steffen said this:
In terms of our coastal zones we’ve got to take seriously the issue that sea levels are rising and storm surges are coming in on a higher sea level.
The sort of thing we saw on an east coast low around the Sydney city area, they’ll become more common, so we’ll have to change our zoning planning and strengthen our infrastructure along the coast.
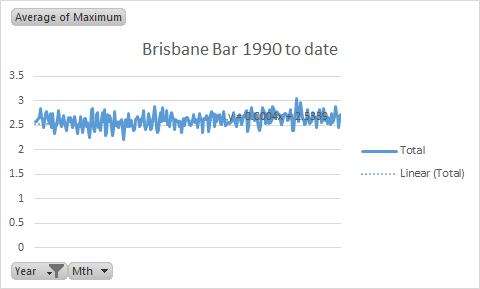
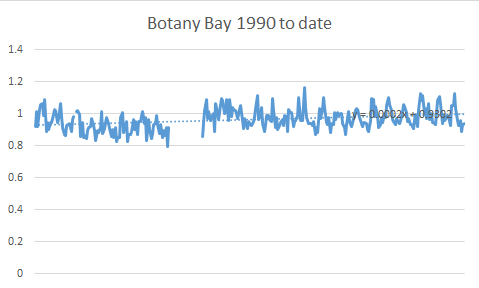
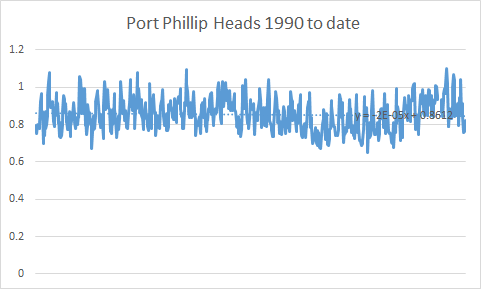
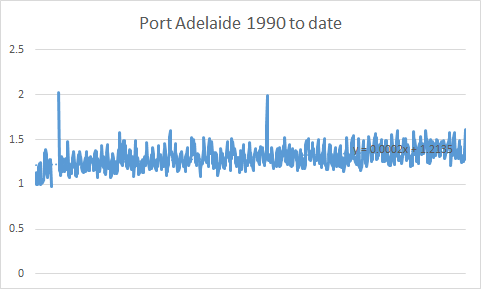
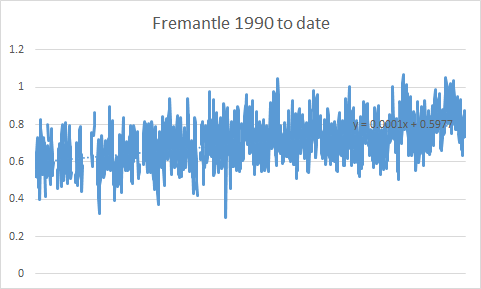
So, exactly how much are sea levels rising. Again, graphs tell the story pretty well. And the answer is, not much on the east coast, but a bit on the west. As water is more or less level wherever you are, the reason that WA is falling is that the coast is actually being tilted down as the continent runs up against the Asian land mass at the north.
This may also have something to do with the fact that there is not much evidence of sea level rise on the east coast.
But irrespective of the cause, the figures tell the story. If sea rise is either not happening, or only very slowly, then you can’t take Professor Steffen’s comments too seriously.
From comments on my previous post I expect someone will object that there is only a small number of geographical locations represented here. That doesn’t matter. The points have been chosen because they are close to large population areas, and so they are the sea level rises that most Australians experience. And as “water finds it own level” these should be very representative of what happens around a very wide area.
The equations on the graphs give you a tool for determining sea level rise on an annual, decadal or centennial basis, or any other basis you care to name. The Y axis is in metres, so 0.001 is a millimetre worth of rise in a month in the x coefficient in the equation. There is really not a lot to see here, and what you can see here is giving us lots of warning to move.
If the continent is tilting, to lower in the west, higher in the east? Then comparable sea rise levels could remain seemingly unchanged in the east, while accentuated in the west?
None of which proves or disproves theoretical sea level rises as a possible consequence of ice melts. A wise man would nonetheless, dispose of seaside real estate assetts in favour of something further inland and higher?
Particularly, given said land could be rezoned for temporary transportable accommodation only? Me? I have a place in the mountains!
Alan B Goulding
Comment by Alan B. Goulding — January 10, 2017 @ 10:15 am
As I sit recovering from the hottest recorded day in January? I reflect on how nice it might be to visit a nearby popular seaside resort, to get out there swimming with the stingers and the sharks. Both of which seem to have had something of a population explosion?
That said, I have come to an arrangement with the sharks, I don’t go in the water and they don’t come on the beach!
On reflection, sea levels seem fairly consistent on our east coast?
However, if (as memory serves) an ABC documentary I watched a couple of years ago is correct, then there’s a large fresh water lake under Antarctica’s ice? That may contain enough water if ever released to raise average global sea levels by as much as 7 metres?
And apparently, only held back by a relatively narrow wall of relatively thin ice?
7 metres (the approx. length of a vertical cricket pitch) is just not that much, but enough it would seem to inundate most of our coastal communities and drown as much as 70% of this nation’s economy?
And dozens of island communities? And like a dam collapsing, virtually overnight? As a 7 metre high tsunami?
Think, one could catch that wave and surf all the way to Hawaii? Always providing, we could get a safe passage guarantee from the resident sharks, in exchange for some multi-million dollar former beachfront properties? Like say, the Gold Coast, the new Venice of the south?
Don’t worry the ( exponentially accelerating?) measurable rate of melt? Probably means, we’re safe for the next 100-50-25-10-5-2 years? Or are we?
Who knows what weight of water when released might be enough to raise global sea levels by as much as 7 metres? Or how inherently strong the eternally cracking crevasse riddled ice might actually be, holding back literally billions of tons of water?
But don’t worry, the story is probably just a monumental beat up by “pseudo scientists”, just trying to boost grant money? Or is it?
Alan B. Goulding.
Comment by Alan B. Goulding — January 16, 2017 @ 9:14 am
Dear Graham,
Firstly if you were really interested in sea level rises since 1990 then there is a perfectly good satellite record which removes to a fair degree any externalities like rising or sinking land masses.
https://climatedataguide.ucar.edu/sites/default/files/styles/node_lightbox_display/public/key_figures/climate_data_set/Nerem-SL-1.png?itok=amqLr7zW
Next you postulated;
“So, exactly how much are sea levels rising. Again, graphs tell the story pretty well. And the answer is, not much on the east coast, but a bit on the west. As water is more or less level wherever you are, the reason that WA is falling is that the coast is actually being tilted down as the continent runs up against the Asian land mass at the north.”
You used the data from Fremantle to support your case. The thing is Fremantle is further away from the northern subduction zone than Brisbane. Here is a map for your edification;
https://upload.wikimedia.org/wikipedia/commons/thumb/b/bf/Tectonic_plates_boundaries_detailed-en.svg/7000px-Tectonic_plates_boundaries_detailed-en.svg.png
Lastly water is not ‘more or less level wherever you find it. It varies dramatically around the world for a number of reasons. But since 2002 the Gravity Recovery and Climate Experiment (GRACE) has returned high level data that teases out many of the factors allowing accurate assessments of exactly how much each is contributing. It can quanitfy the contribution for instance of melting ice from Greenland.
https://en.wikipedia.org/wiki/Gravity_Recovery_and_Climate_Experiment
If you are finding comfort in looking at local datasets to assuage your own concerns about sea level rises on the east coast of Australia then go for it. But please don’t make the case that it weakens the science around global levels. It doesn’t.
Any chance that future graphs be presented with the same y proportions? It would help give a clearer picture.
Comment by Steeleredux — January 21, 2017 @ 9:45 pm