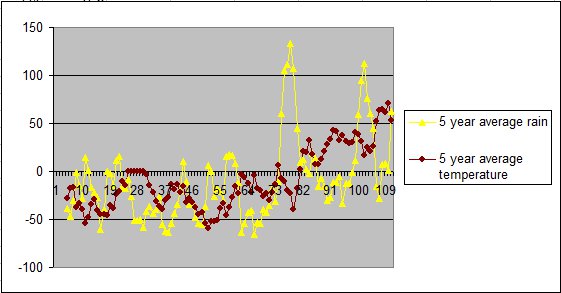
Graph of rainfall and temperature anomalies for Australia since 1900
Opinion on politics and social policy
from
across the board
Graph of rainfall and temperature anomalies for Australia since 1900
No comments yet.
RSS feed for comments on this post. TrackBack URL