“Experts”, the local council and environment groups say he is, but the actual figures say “maybe not”.
There is no global warming occurring at the moment, but there has been global warming over the course of the 20th Century, and while CO2 levels continue to rise, the logarithmic effect this has on temperature means a lot more CO2 is required for a given amount of warming.
All of which suggests, if there was going to be an acceleration of sea level rise we should already see evidence of it, and that as long as the pause remains we shouldn’t see much sea level rise at all.
So, here are the sea level figures for Brisbane provided by the Center for Operational Oceanographic Products and Services (CO-OPS), a US government body, which along with its predecessors has been gathering USA tidal data for 200 years (longer than the instrumental temperature record is available).
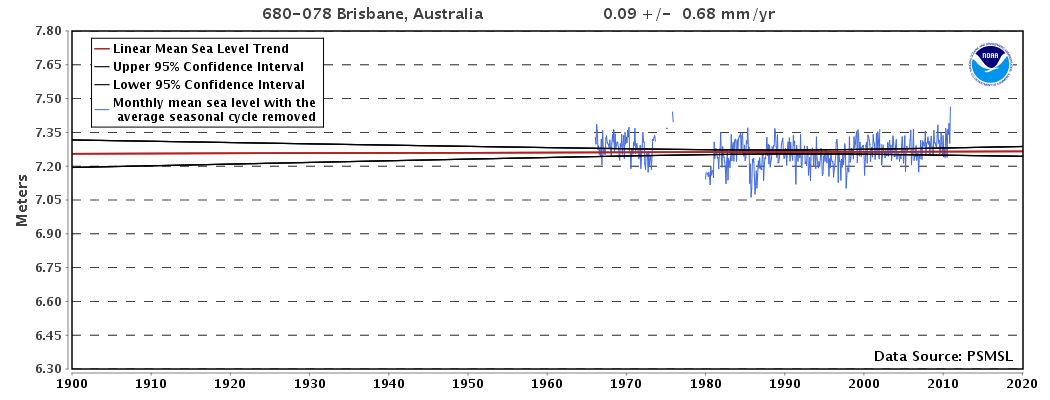
Source:http://tidesandcurrents.noaa.gov/sltrends/sltrends_global_station.htm?stnid=680-078
There has been no statistically significant increase in sea level in Brisbane at all with the measured increase less than the measurement error. There are no figures for Moreton but as it and Brisbane are on the same stretch of water I think we can safely infer that the 800 mm over the next 85 years, which the council has written into its town planning instrument, is fanciful.
That would be a rise of 9.4 mm per year when over the last 49 years there has been, as best anyone can tell, one hundredth that amount of sea rise per year, if there has been any rise at all.
I’m sure it won’t take long for a commenter to point out that the IPCC forecasts are different, so the measurement must be wrong.
To this I would say two things.
First, the IPCC projections for temperature on which the IPCC forecasts are based have been invalidated by the last 15 or 18 years of temperature so that now all of the models are running hotter than reality. In which case, the best forecasting stance would be to take the business as usual case and project it forward.
Second, even if the IPCC forecasts were correct, they are global, and local effects can overwhelm global effects. The east coast of Australia is rising at the same time as the west coast is falling because the continent is tilting as continental drift pushes it up under Asia. So while there might be more water in the oceans we won’t notice it as much, or apparently at all, on this side of our island.
In which case, a council that applies an 800 mm projection is being plain ridiculous.
Of course, if Seeney had been wise, he would have commissioned a scientific committee to write all this down in a 100 pages or so.
The council claims that it may be liable for failing to take climate change into account in planning. This could easily be cured by state legislation.
Sea levels do rise and fall, with the sea being around 100 metres lower on the east coast of Australia than today a mere 15,000 years ago. The Whitsundays were mostly once mountains, and there was no Great Barrier Reef.
Any port built on the east coast at that time would now be well underwater.
We like to live near the water, and there are commercial reasons why we should build cities near the water. The idea that fear of climate change means that these should be built so far inland that they could never be affected is ridiculous.
Cities are not immutable. They change and are redeveloped. If I build in an area which is inundated in 100 years time, then that should be at my risk, and not the council’s.
On these figures, I’d be happy to take the risk.
The prices at which waterfront properties change hands suggests that the weight of money is with me. And with Jeff Seeney.
Typical claptrap from a cherry-picking denier.
First, the choice of NOAA data. The actual NOAA advice re sea level change is here: http://oceanservice.noaa.gov/facts/sealevel.html and is that, during the 20th century and beyond, average annual rise is 0.04 to 0.1 inches per annum, ie 0.1 to 0.25mm per annum, or 10 to 250mm per century, which is a reasonable planning interval on which to design cities.
I won’t bother with the other facts and opinions displayed in this article. Suffice to say that it is more opinion than fact.
A thought: Given that the largest glacier in the world, in Antarctica, is currently accelerating towards the ocean and that it contains sufficient ice to raise the world’s oceans by 6.6 metres, what is his plan for, say, 200 years, when this may have come to pass?
800mm may well be only the start.
I admit that these are early days in the demise of said glacier and others like them in Greenland and Russia, but is it not prudent to allow in one’s town plans for such events, even though they may seem distant today?
Geoff, what advice should Mr Seeny be offering Bundaberg at 2 mm/year or Weipa at 3.5, from the same NOAA tables? Should they plan for 3500mm sea level rise during the coming century>
See Weipa’s at: http://tidesandcurrents.noaa.gov/sltrends/sltrends_global_station.htm?stnid=680-021
Comment by John B — February 10, 2015 @ 8:22 am
The Australian BOM maintains 16 ocean level measuring stations around the Australian Coast and has done so for about 22 years. For the East Coast the average sea level increase per annum has been 3.2mm per year.
I have lived for the last 28 years on the foreshore of Lake Macquarie and the change in level over that time (nearly 90 mm) is quite noticeable. Because of the constraints imposed by Swansea channel the tidal change in the lake is only about 125 mm. However, a persistent high or low atmospheric pressure has a much more noticeable affect as does a period of heavy rainfall over the lake’s catchment. The long term change is still quite noticeable among those other confusing signals.
Comment by John Turner — February 10, 2015 @ 8:45 am
Yes John B.
And not only is the largest glacier in the world something of a worry, but a truly massive body of fresh water down there as well, we’re told, only held back by a small body of melting ice; which when released, will raise global ocean levels, we’re told, by around 3 metres, and overnight as some sort of tsunami like event.
And made more likely sooner rather than later, by Antarctic water temperatures that have risen, we’re told, by 4C!
Causing as the first effect, unprecedented melting.
And none of the oldies would now recognize today’s Alaska, with the disappearance of summer ice and a melting of formerly permanently frozen permafrost or tundra, which is creating hundreds of new lakes and releasing annual tons of new methane, adding exponentially to the ongoing melt; and a perviously unheard of northwest passage.
There are visible changes that simply can’t be argued away or denied; for the sake of the (I’m all right Jack, the rest of you can go visit the nearest taxidermist) commercial dollar!?
Now, were it down to me, I would permit only new development at 10 metres or higher!
And for the same reason as there is now a significant levy around Charlieville!
One in 100 year floods that can occur every ten years or so, and ever higher king tides.
This would mean, a lot of open space around our foreshores, which could accommodate parks, market gardens, sport venues, walkways, bikeways, mobile home parks and all manner of similar development?
And opening up the inner city seems to mitigate some criminal activity, which seems to like largely uninhabited industrial development and few if any permanent domiciles? (witnesses)
Existing buildings would live out their use by date and just not be replaced by new development!?
Such as canals/reclaimed land made high enough to accommodate the new planning guidelines and so on?
Hardly a bad thing, and a (the new Venice of the south) more livable city?
And properly planned canals could accommodate completely self contained floating cities/very low cost relocatable housing/serve as new byways and highways, creating even greater access?
Jeff Sweeney has no scientific credentials whatsoever, and even argued against the formation of the patently pragmatic LNP.
Which for mine infers a self obsessed/indulging personality, who’s professional judgement, may well be seriously clouded by burning personal ambition?
Were it entirely down to me, I wouldn’t ask him to organize a chook raffle, let alone be the final arbiter, in coastal city town planning outcomes.
If anyone commenting here can unequivocally guarantee, that sea levels won’t rise by around 3 metres tomorrow or the next day; or in any currently living person’s lifetime, then perhaps allowing continuing development on coastal flood plains is permissible, as a calculated personal risk.
It’s your money after all, and the grandkids will manage?
Alan B. Goulding.
Comment by Alan B. Goulding — February 10, 2015 @ 10:58 am
I give you real data about a real situation and you accuse me of cherry picking, then pick irrelevant data like global averages or Lake Macquarie. Then John B demonstrates an inability with basic maths overstating potential rises by a factor of 10.
John T makes an interesting claim about Lake Macquarie, but without any sources. He’s claiming over 3 mm per year when Fort Dennison at Sydney is only 0.65 p.a., which makes his claim unlikely.
However, I checked Newcastle as well, and it appears John T has done the perfect cherry pick. I bet he didn’t move to Lake Macquarie in 1987, just claims to have.
There has in fact been an increase in sea levels at Newcastle of just over 94 mm in that time. But if you picked 1988, the year after, the increase is only 36 mm. In fact, if you picked 2001 there has been a fall of 38 mm. Unfortunately the NOAA dataset doesn’t go back further than 1966. You can download it from here to see how John T has tried to game statistics. http://tidesandcurrents.noaa.gov/sltrends/sltrends_global_station.htm?stnid=680-135
Should have known better than to try it on this blog!
Fact is every locale is different and that has to be taken into account. Applying a blanket figure is ludicrous, which is what the councils are doing.
Making townplanning laws take account of JohnB’s imaginary 6.6 metres would mean huge sections of our capital cities couldn’t be developed, and for no particular reason, just that he can imagine it might happen.
If it does happen it will take centuries, and we’ll adjust. No point planning on that basis.
Comment by Graham — February 10, 2015 @ 11:27 am
Agreed, a factor of ten error appeared in my work, but the article is still a classic cherry-pick.
Comment by John B — February 10, 2015 @ 2:00 pm
Well, one mathematical error down, but not the last JohnB. Would you admit that the figures you cite as being projections of sea level rise are 1.25% to 31.25% of the figure that the council is using? Would you also be prepared to admit that the sea level in Brisbane is increasing more slowly than the global average, and therefore something is compensating for the slower increase in sea level here? That something being likely to be a gradual rising of the land height?
Comment by Graham — February 10, 2015 @ 3:03 pm
No.
Yes.
Yes.
If Brisbane is slowly rising relative to other locations, then basing one’s arguments on Brisbane is a classic example of a cherry-pick, is it not?
I know that some will choose to say otherwise, but Graham selected a single city from a tabulation of about 250, of which 3 or 4 were in Queensland.
What is the logic which speaks for or against the reality of sea levels rising on a broad scale, yet which considers only data from a single location, which was selected because it gives the appearance of supporting the hypothesis that sea level rises in Qld are not happening and thus that the political decision of Mr Sweeney and his subsequent direction to councils State-wide and not only in a specific Shire that sea level rises must be ignored in town planning policies?
The original table included data from about 250 locations world-wide, many of them dramatically higher than Brisbane. It also does not provide any analysis for the anomaly, which Graham has put down to plate tectonics. Reference needed!
Cherry-picking is cherry-picking is cherrypicking…
I await Graham’s next 249 articles, which will provide excuses in relation to the remainder of the data.
BTW, Graham. Brisbane is located on a river which is well known to be subjected to other influences than plate tectonics, hence flooding on a grand scale not long ago.
Had it rained?
Comment by John B — February 10, 2015 @ 3:36 pm
JohnB, you are showing just how ignorant of the principles of science you are. Firstly you refuse to acknowledge the mathematical fact that the sea rise the council is planning for is somewhere between 3 times and 80 times as high as the projections you quote.
Second, you accuse me of cherry picking because I select the tide gauge closest to the council that has been affected. What would you select? A tide gauge in Guatemala? Perhaps Antarctica? That would be cherry picking and stupid.
Third you try to confuse people by saying Brisbane is located on a river. Brisbane is actually located on Moreton Bay and they take the tide readings from the Port of Brisbane. Do you think the premium organisation for keeping track of tide heights would use a second rate position for their definitive dataset?
Fourth, if it had rained, and if that was a factor, then water height would be lower, not higher, but of course what we are looking at is a series of monthly averages. Might have escaped you, but it doesn’t flood all year.
If I were you I’d be embarrassed to come back to this thread. Your record of error is almost perfect.
Comment by Graham — February 10, 2015 @ 5:38 pm
Graham, rude and ugly does not substitute for discussion. I’m OK. See you around.
Comment by John B — February 10, 2015 @ 11:29 pm
John B you are right. I should have let your opening abuse speak for itself instead of wasting my time researching to show that each of your points was wrong.
Your approach is typical of the trolls who “police” the web trying to enforce the socialist left hysterical view of global warming.
You start with abuse, and when you are shown to be wrong, you end with abuse. Ad hominem is your stock in trade. Having been knocked off this bridge I doubt I’ll see you back in a hurry but I’m sure you’ll be back with sneers, snide insinuations, abuse because it’s in your DNA.
Some day I might do some research into the personality of the troll. In the meantime you might be interested to read this http://www.theguardian.com/society/2015/feb/02/what-happened-confronted-cruellest-troll-lindy-west?CMP=share_btn_fb
Comment by Graham — February 11, 2015 @ 7:24 am
John B
Everything you say is disproved here:
http://forum.onlineopinion.com.au/thread.asp?article=17082
Answer the questions or admit you are wrong.
Comment by Sienna — February 11, 2015 @ 9:22 am
Dear Graham,
I suppose both sides of this debate can be accused of selectively applying due diligence. If this was a data set supporting an increase in temperatures you would have been all over it, dissecting the minutia and making sure that any discrepancies were highlighted.
For instance if the site location, or the instruments used, or the base datum point were altered you would be flagging them as valid reasons to cast doubt over the data’s veracity.
And I would be saying fair enough, good scientific scepticism is an vital part of the dynamic.
So let us look at the dataset you provided to support your contention that “There has been no statistically significant increase in sea level in Brisbane at all with the measured increase less than the measurement error.”
Over that period there have been 4 changes in instrument type and 2 different locations for the Brisbane gauge;
1964-66 Original gauge float/stilling well on Bishop Island
1966-80 Change in location – float/stilling well at West Inner Bar
1980-82 Change in instrument type and location – pressure diaphragm gauge at Bishop Island
1984-2005 Change in instrument type – Pneumatic bubbler (BUB)
2006- Change in instrument type – Vega radar PULS42
Also over that period there were three changes in datum levels from the PSM marker number 21764;
1966-71 set at 2.9m – 1972-75 set at 2.875m – 1976-now set at 3.102m
http://www.psmsl.org/data/obtaining/rlr.diagrams/822.php
Was there any artificial filling of the data? Well yes;
“The readings are corrected to datum by means of the water level checks. Outliers are detected by eye using non-tideal residual plot. Breaks are filled using a maximum of 15 predicted readings fitted to the adjacent observations.”
http://ilikai.soest.hawaii.edu/rqds/pacific/doc/qa331a.dmt
Given all of the above I would suggest given your past dismissal of ‘corrupted data’ we can only comfortably take the data from the last location change. Here is that list;
http://www.gloss-sealevel.org/station_handbook/stations/58/data/msl_822.txt
While there are some years flagged for attention, given your past requirements, I think this is the best we have to test your contention on.
Plugging those figures into a regression calculator gives a slope of 2.743 or a 2.743mm rise in sea level per annum. To make it easy for you I have provided the data and an online regression calculator for you to check my results (see below).
While granted this is no where near the 800mm rise over the next 85 years predicted in council documents (2.743 x 85 = 233mm), who can say the rate will remain constant especially with ice-sheet intrusion into the equation.
This is the result derived by applying the standards you have proscribed for climate data i.e. removing non contiguous data. I do not believe they support your contention.
1980,7157
1981,7251
1982,7217
1983,7266
1984,7308
1985,7224
1986,7174
1987,7239
1988,7273
1989,7266
1990,7266
1991,7253
1992,7253
1993,7223
1994,7226
1995,7231
1996,7227
1997,7209
1998,7258
1999,7294
2000,7270
2001,7289
2002,7260
2003,7278
2004,7266
2005,7279
2006,7250
2007,7285
2008,7298
2009,7304
2010,7325
2011,7343
2012,7323
http://www.alcula.com/calculators/statistics/linear-regression/
Comment by Steeleredux — February 11, 2015 @ 1:20 pm
Hi Steele, I’d be obliged if you could direct me to the “standards I have proscribed (sic) for climate data”. But in any event, you can’t logically have it this way. As you are apparently happy to accept data that has been adjusted as rigorous, then your analysis is not rigorous on your own terms, irrespective of any alleged inconsistency in my treatment.
It would be cherry picking by you to say that in this case you were going to use my “bad” methodology rather than your “good” methodology, which gives you a result you like.
I also wonder, given you seem to suggest that we should be suspicious of changes in instrument type why you don’t just choose the last instrument.
You might also be interested to know that when the gauge was moved from Bishop Island to its present spot it was actually moved a few hundred metres only to the other side of the channel. As water tends to be level, the calibrations involved would have been trivial, compared to moving a weather station kilometres away from where it was originally.
I suspect you mucked around with the various variables for a while to get an answer you liked. When you take the whole data set from this source, and just delete the bits where they have bad data, then you get a slope of .0572. Almost flat.
Comment by Graham — February 11, 2015 @ 3:41 pm
Dear Graham,
Sorry, inappropriate use of proscribed or ‘removing’ might have read ‘including’ to make sense.
As to your standards;
“I’m not sure why anyone uses the land-based temperature record. It isn’t transparent, it is subject to all sorts of adjustments, many of which are admitted by the various record keeping organisations to be subjective, and the datasets don’t actually appear to be homogenous (sic). And this applies to all of the commonly used temperature sets. If you want me to comment on why various sceptics might use the Hadley data perhaps direct me to specifics.”
Posted by GrahamY, Wednesday, 27 January 2010 1:08:19 PM
http://forum.onlineopinion.com.au/thread.asp?article=9906#160697
As to the point I was making I can’t imagine how I could have been clearer.
“I suppose both sides of this debate can be accused of selectively applying due diligence.”
You have been very diligent in challenging any even slightly suspect data that has supported AGW. As I said I have no problem with you doing so. This time how ever you are the one delivering the contention, that “There has been no statistically significant increase in sea level in Brisbane at all with the measured increase less than the measurement error.”
After looking at the figures you provided and doing some further research my position is that “I do not believe they support your contention.”
Can such a contention be invalidated by just 30 years of data?
Well you seem quite comfortable doing so;
“the IPCC projections for temperature on which the IPCC forecasts are based have been invalidated by the last 15 or 18 years of temperature”.
Setting one standard for your own evidence and another for those with opposing views is human but is rightly open to challenge.
The old adage, ‘you make the bed you lie in it’ is so deliciously apt for our current prime minister that I am loathed to direct it anywhere else but it does have currency here as well.
As to why that particular data set – because that was what was used when the UH Sea Level Center/National Oceanographic Data Center did their quality assessment on that particular site.
http://ilikai.soest.hawaii.edu/rqds/pacific/doc/qa331a.dmt
Comment by Steeleredux — February 11, 2015 @ 5:02 pm
Steele, you either stick with your standards or you change them. You’ve changed them to cherry pick an argument.
I prefer the satellite data on temperature because they aren’t susceptible to the adjustments that land based data are. But I use whatever data are available.
In the case of tide data there aren’t any alternatives. So we’re stuck with what is available.
I didn’t use the shorter time scale – you did. I used the time scale that was provided, and it is longer than the one you use.
You also argue that adjusted data is fine, so you are the one who is caught in bed naked without a sheet to hide it.
Perhaps you will use more care next time you advance an argument.
In this case, on your own standards, you have no basis for challenging the fact that sea levels in the Moreton Bay region of Queensland show now discernible increase.
Which leads to the conclusion that if global sea levels are increasing, the coast is rising as fast as the sea.
Of course I wouldn’t expect you to accede to any of this because you are trolling like the others. The technique is to throw up irrelevancies in the hope of confusing casual readers because you want to win your argument by hook or by crook.
Even though you concede that the council’s estimate is more than 3 times too high.
I love gifts that keep on giving.
Comment by Graham — February 11, 2015 @ 11:37 pm
One can only imagine the sort of tectonic plate pressure, that is great enough to lift/tilt a continent! The new fault lines this would create, which in turn wold surely allow possibly copious gas and oil to escape into the environment?
And the best possible reason to get in there and put in some pressure relieving wells.
And given a possible reserve to rival the M.E., to our “immediate north,” earn enough income to retire all of our debt?
For mine, using indigenous hydrocarbon types that in common use, produce 75% less total carbon. Has just got to be a superior outcome, when compared with the total carbon produced by what we currently import?
But only if we are genuinely concerned with the environment, G.W., or the economy!
Simply saying we don’t know what is there, just isn’t good enough anymore!
And of course if we never ever look, we’ll never ever know!
And pray tell how else are we to fund the new alternatives, like algae sourced oil, given the (20 year) lead time needed? Well?
While a possible rise in sea levels could and should concern us all, there are far more pressing practical problems to attend to first!
Alan B. Goulding.
Comment by Alan B. Goulding — February 12, 2015 @ 6:27 pm
Dear Graham,
Well that is just beautiful mate. I went to a reasonable amount of trouble to have a proper look at the data, research the history of the site, track down the quality assurance document and put together what I thought was a logical challenge to your contention and you are now labeling me a troll? When in the hell did you get so bloody thin skinned?
You wrote;
“In this case, on your own standards, you have no basis for challenging the fact that sea levels in the Moreton Bay region of Queensland show now (sic) discernible increase.”
Which of course plainly translates into;
“In this case, on your own standards, you (Graham) have no basis for asserting the fact that sea levels in the Moreton Bay region of Queensland show no discernible increase.”
And that is exactly the case I have been making.
But instead of arguing the point you fling out the label ‘Troll’ which you seem to think gives you the right to dismiss it out of hand.
Well to me it seems rather petulant, but it does draw the exchange to an (in my opinion unseemly) end.
Good day to you sir.
Comment by Steeleredux — February 12, 2015 @ 10:51 pm
I wouldn’t get so emotional Steel, after all, if the continent is rising as fast as the sea levels we’ll be fine?
The only real worry will occur, when the tilt is finally enough to cause the rivers to all run backwards or to the west?
I mean, the westerners are always complaining about not enough water! A win/win solution all round surely?
Alan B. Goulding.
Comment by Alan B. Goulding — February 13, 2015 @ 9:05 am
Interesting post Steele. So you tell me that I am wrong to question adjustments in temperature records, but then criticise my work because in this case I accepted the adjustments that were made.
Assume for a second that you were a teacher and I was your student. I’ve been completing problems using a methodology that you tell me is wrong and you’ve been marking me down accordingly.
Then I complete a problem using the methodology you tell me is right, and you tell me that I am wrong again, because having used the other methodology I am bound to use it all the time.
So it appears that it doesn’t matter which method I use in your eyes I will always be wrong.
What should I conclude from this. That you have a serious interest in the answer, or just that you have taken a set against me? And if the latter, how is that different from trolling?
There are phrases for the position you are trying to put me in – “Damned if I do and damned if I don’t,” or “Heads you lose, tails I win”.
Comment by Graham — February 13, 2015 @ 5:02 pm